Wireless Modbus Demo Guide #
Demo Connections #
This guide demonstrates connecting the Wireless Modbus Module, featuring a port with four pins: Vin, GND, A, and B.
Likewise, the Sensor and Relay devices offer one or more similar ports, each with pins designated as A, B, GND, and VCC. The ‘A’ and ‘B’ pins facilitate RS485 connections, while VCC and GND pins cater to power connections, requiring a power supply voltage of 5V or greater.
Connection Guidelines #
Ensure the correct pins are connected as advised below:
- A to A
- B to B
- V to V (either Vcc or Vin)
- G to G (represents GND)
Configuration #
It is crucial that the RS485 baud rate be set correctly. For example, the sensors support only 4800 bps. The relay RS485, however, is compatible with 4800, 9600, and 91200 bps. Hence, we suggest configuring both the Wireless Module and the relay to 4800 bps for peak performance.
Demo GUI Guide #
Modbus RTU Serial Client GUI version: 0.8
The Demo GUI’s main window features three dock windows—Indicator, Sensor, Command—a toolbar with various control buttons, and a status bar at the bottom displaying serial connection states and settings.
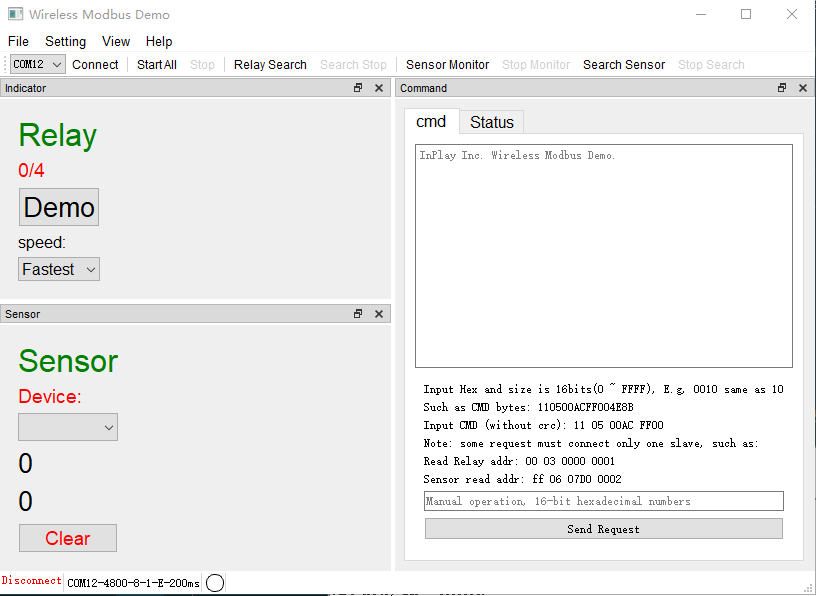
The Toolbar has changed in version: 0.9

Operations #
Steps:
- Confirm Serial settings
- Ascertain Modbus request and response patterns of relay and sensor
- Connect COM port
- Scan devices
- Control devices
Serial Configuration #
Navigate to Setting/com to open a dialog window and modify serial settings parameters such as baud rate, data bits, stop bits, parity, and timeout. Click “confirm” to apply these settings.
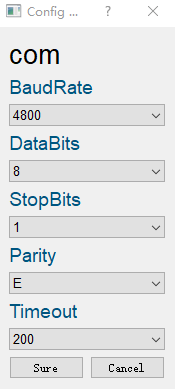
Relay Configuration #
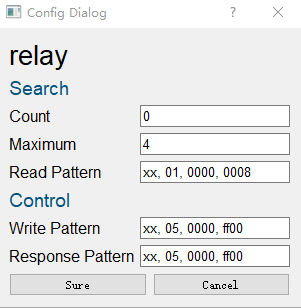
Access Setting/relay to open a dialog window and adjust the relay settings:
Search
- Count: Number of “relay” devices found. This parameter may be omitted.
- Maximum: The number of devices required. The search halts when the count meets this figure.
- Read Pattern: Triggers a search for relay devices upon clicking the toolbar’s
Relay Searchbutton. For instance,xx, 01, 0000, 0008represents a Read Coils request in Modbus RTU format without crc16.
Control
- Write Pattern: Functions akin to Read Pattern; employs Function 05 (05hex) Write Single Coil.
- Response Pattern: Reactions following the requests.
Sensor Configuration #
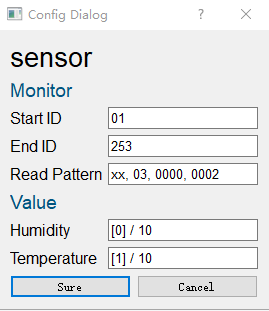
Select Setting/sensor to amend sensor configurations:
Monitor
- Start ID: Commencing address ID of the sensor device when monitoring is active.
- End ID: Terminal address ID of the sensor device when monitoring is active.
- Read Pattern: Command request for procuring sensor data, using function code 03.
Value Upon receiving the slave’s response, the GUI parses the data list and employs formulas to calculate values.
Connect and Run #
Choose the appropriate COM Port and hit the Connect button in the toolbar. The status bar will exhibit the connection state.
Version 0.9 as below:

Version 0.8 as below:
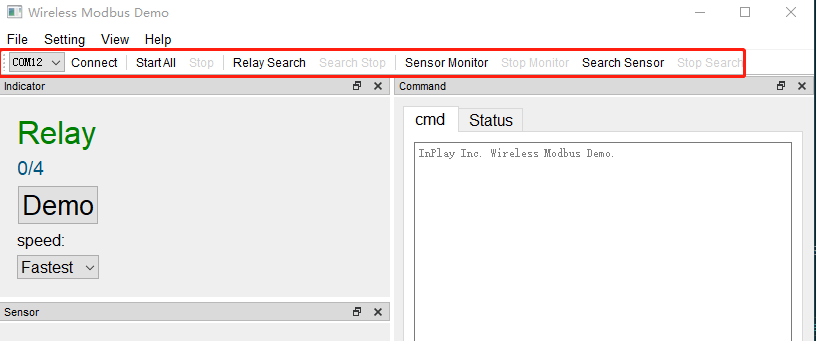
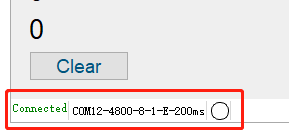
Pressing the Network Scan Discovery (which is Start All in v0.8) button ignites the Relay Search and Sensor Monitor, proceeding as per the Settings to dispatch requests. The Command dock window relays messages of both requests and responses.
Should relay or sensor devices be located, the Indicator and Sensor dock windows will relay pertinent information such as “lamp buttons,” alongside temperature and humidity graphs.
Version 0.8 as below:
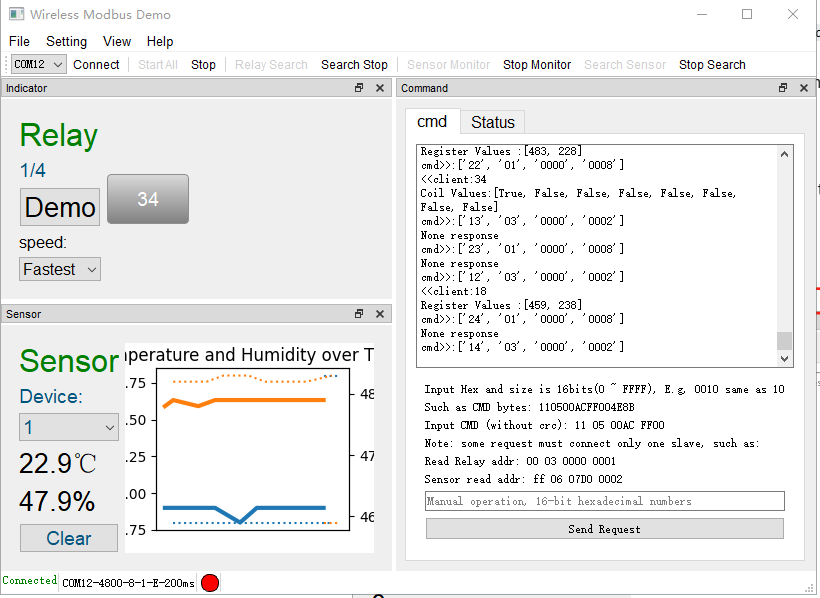
Indicator and Sensor sections incorporate selectors and buttons for demonstrating various actions.
And in version 0.9 update the sensor’s dock window:
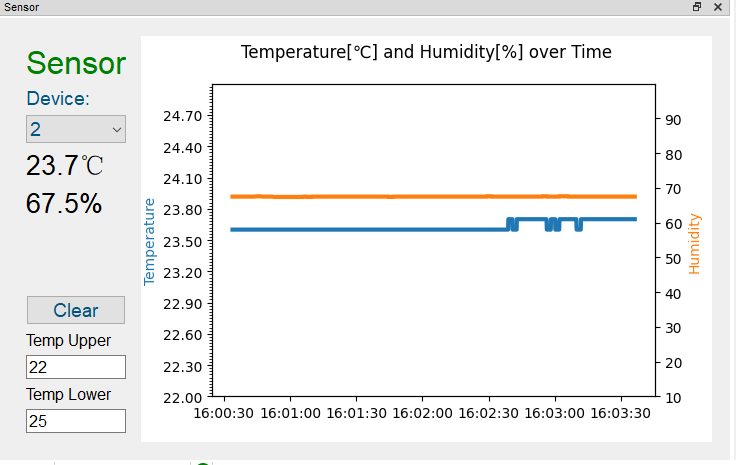
Set “Temp upper” and “Temp lower” to adjust the temperature display limits on the graph.
Manual Command Input #
Located at the Command dock window’s base, a manual command input area exists for entry of Modbus RTU requests (sans crc). Click Send Request post-entry to dispatch the command.
Status in Command #
The Command dock window’s Status presents a tally of the requests and responses.
An input field is provided to insert metrics for computing the packet loss rate. When left blank or set to zero, all data is considered in the statistic.
Menu #
Additional operations within the menu are outlined here. Clicking File/Restore Setting regenerates a default setting.json file, which is then loaded by the Setting menu option.
Editing the setting.json file can be accomplished with an external editor, replacing the same-name file in the GUI program’s directory.
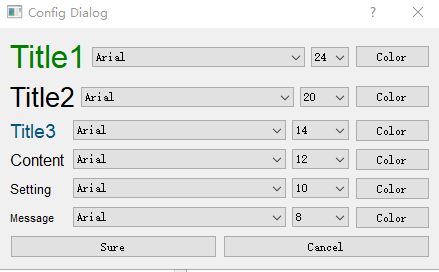
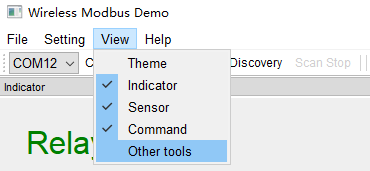
The View menu permits modification of the GUI’s visual appeal, such as font selection, and toggles the display status of Dock Windows.
In version 0.9, View menu permit toggles the display of “other tools” in toolbar.

The Help menu grants access to assorted explanatory documents, including a GUI usage guide.