Debug Guide #
Introduction #
This document provides a guide on how to use keil to debug project to the IN6XXE chip.
Debug Step: #
Enter Debugging #
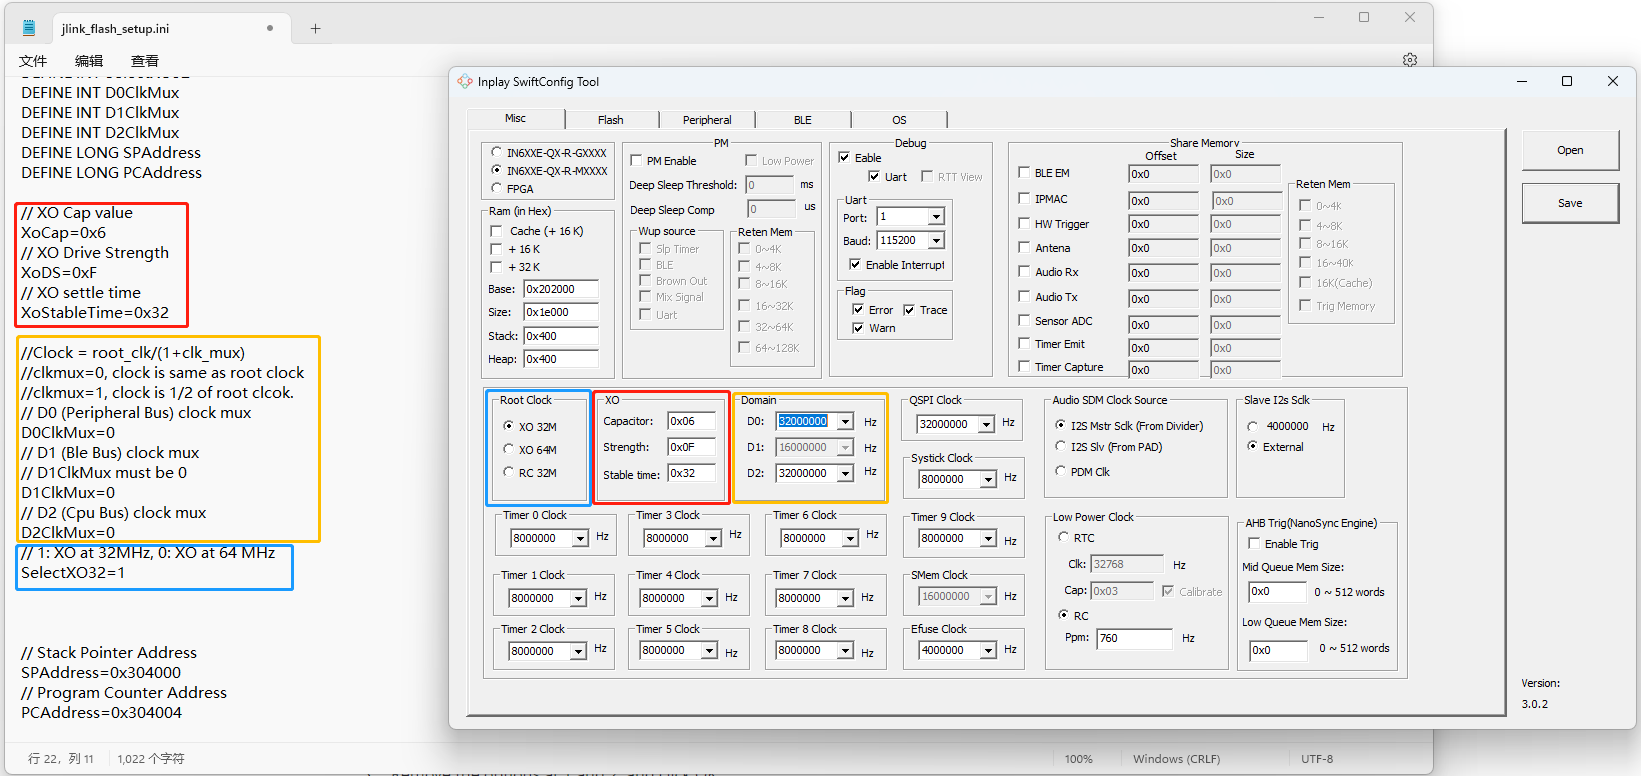
Copy jlink_flash_setup.ini file in in-dev\proj\common\JLINK to project directory
- Edit .ini file with following steps
(1) change the setting in jlink_flash_setup.ini according to the in_config.h.
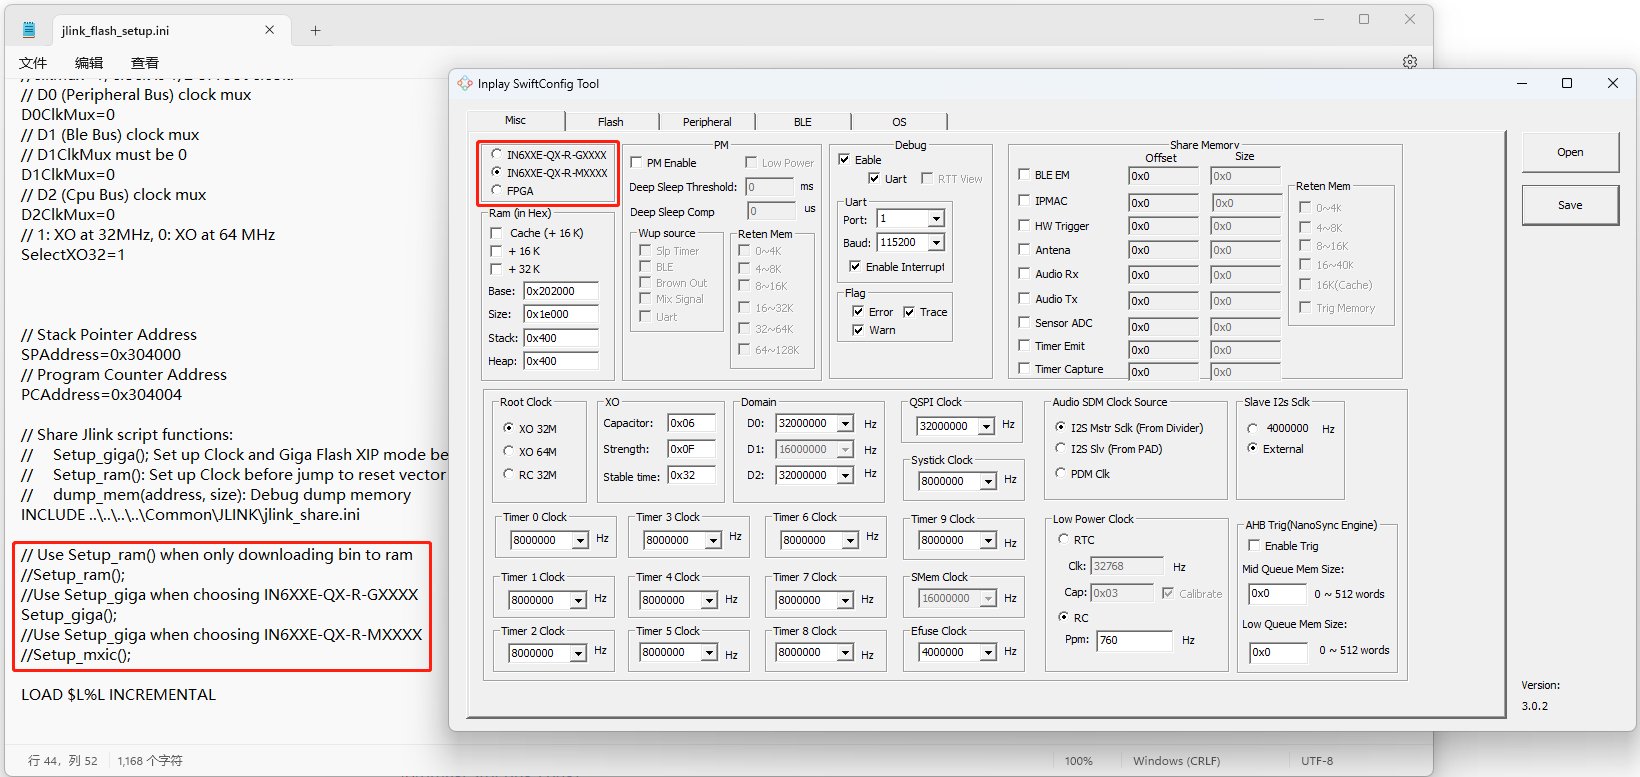
 (2)change the setup mode according to in_config.h
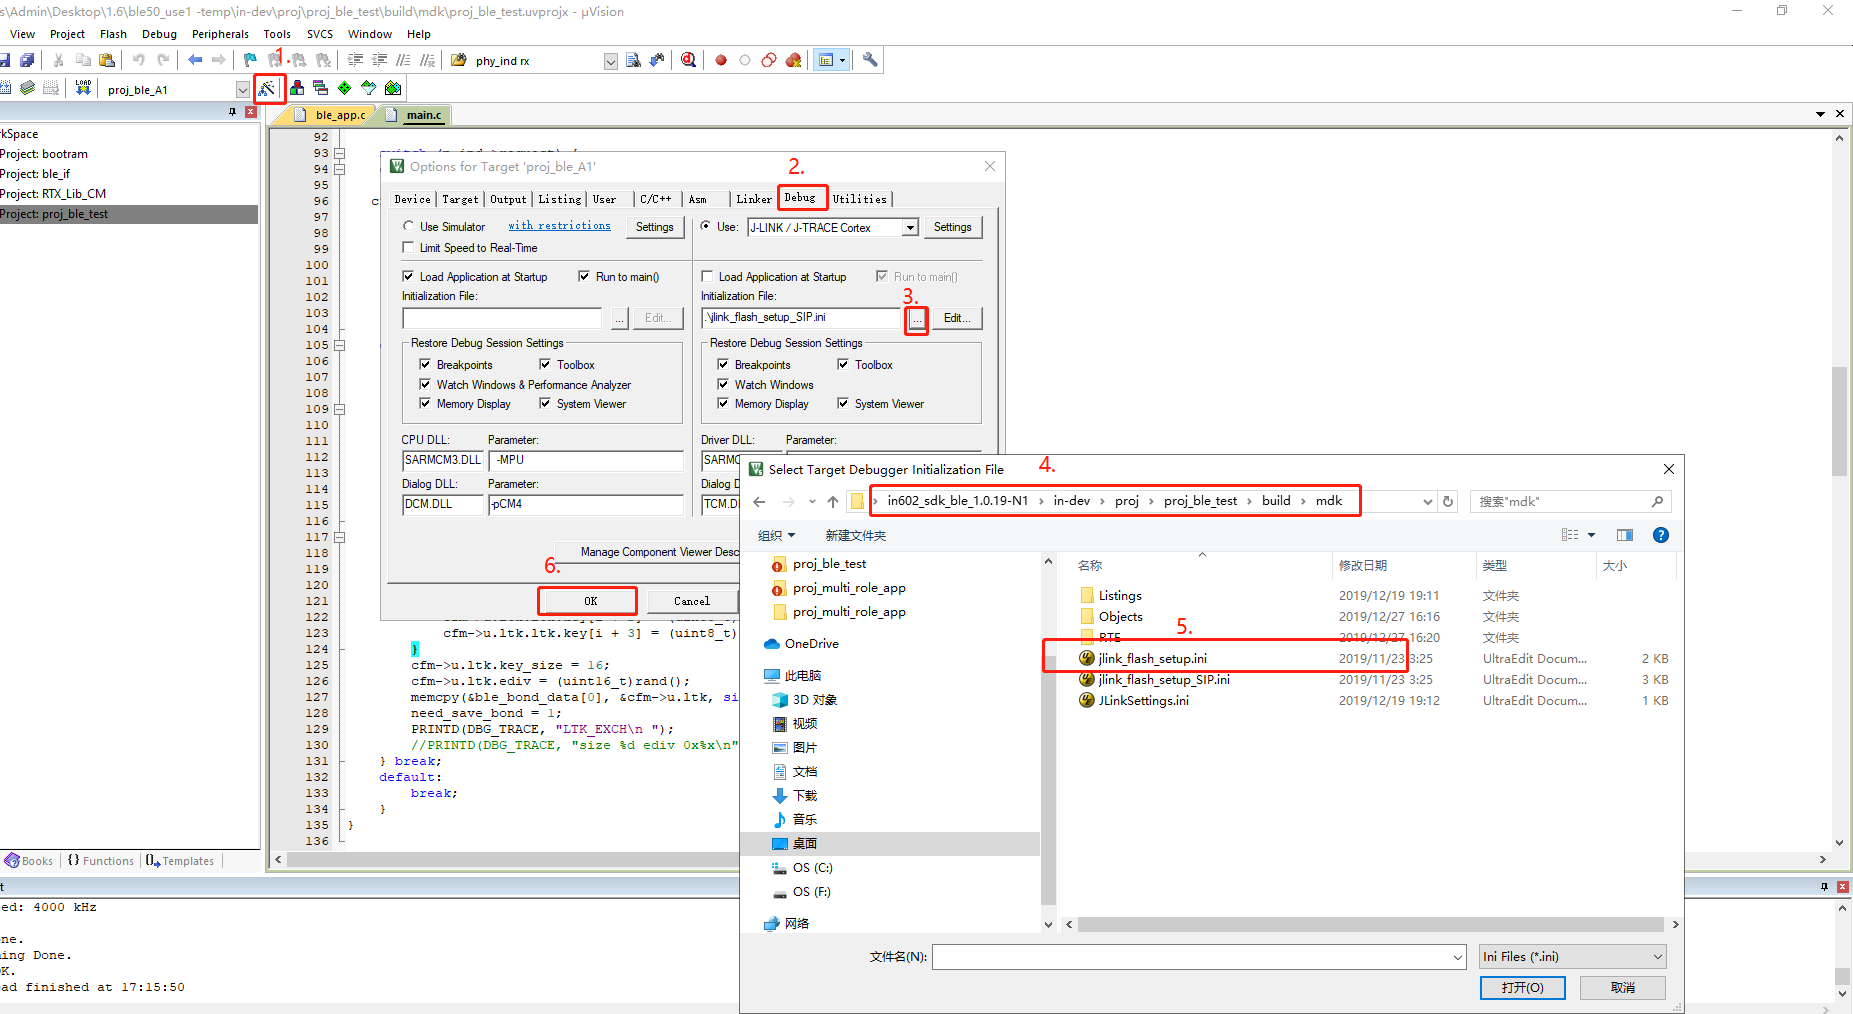
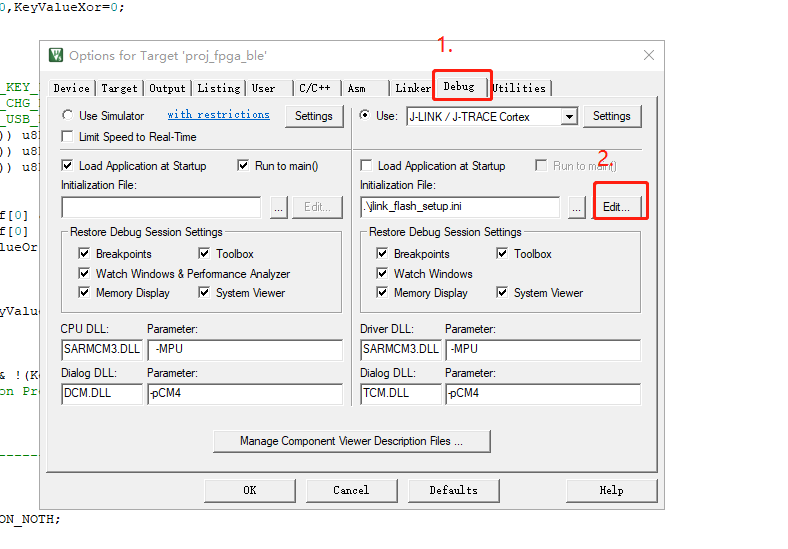
- Follow these steps to select the .ini file.
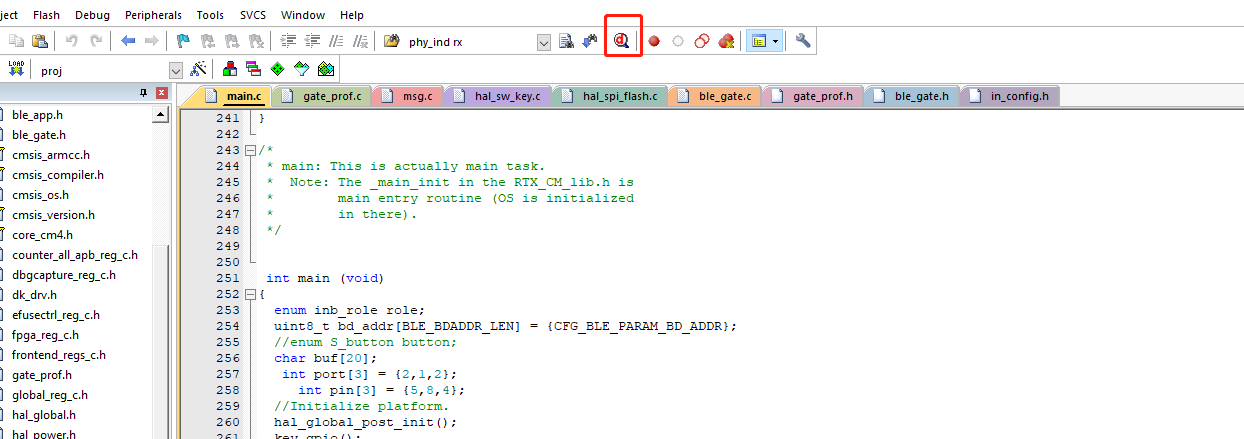
- Click the debug button.
- Enter debugging mode, where you can perform simulation debugging.
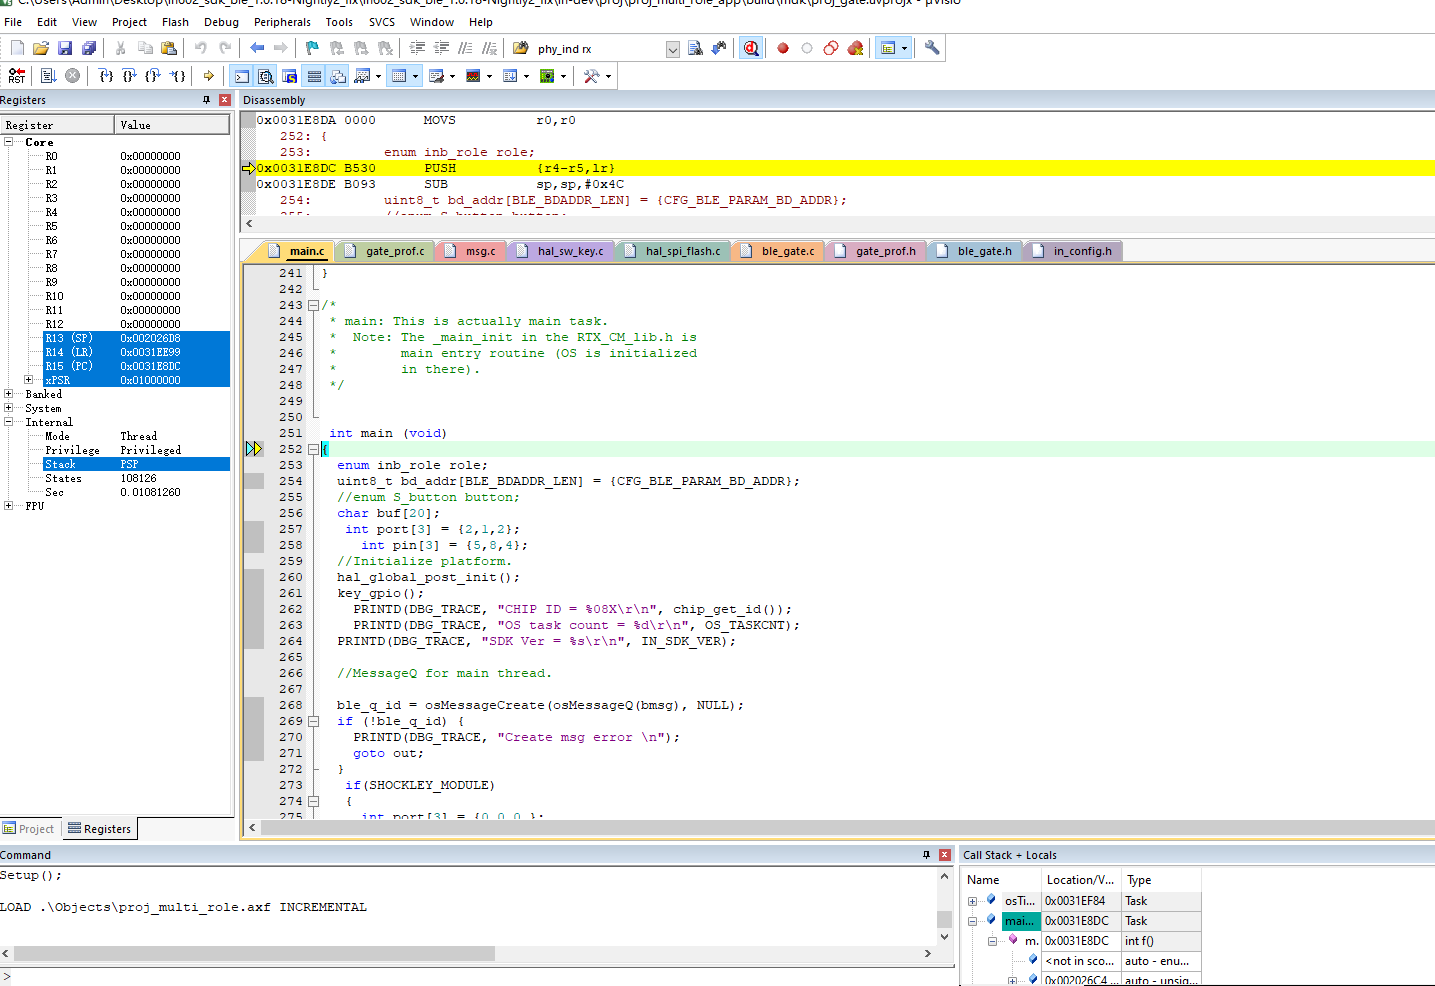
Entering Debugging While the Program Is Running #
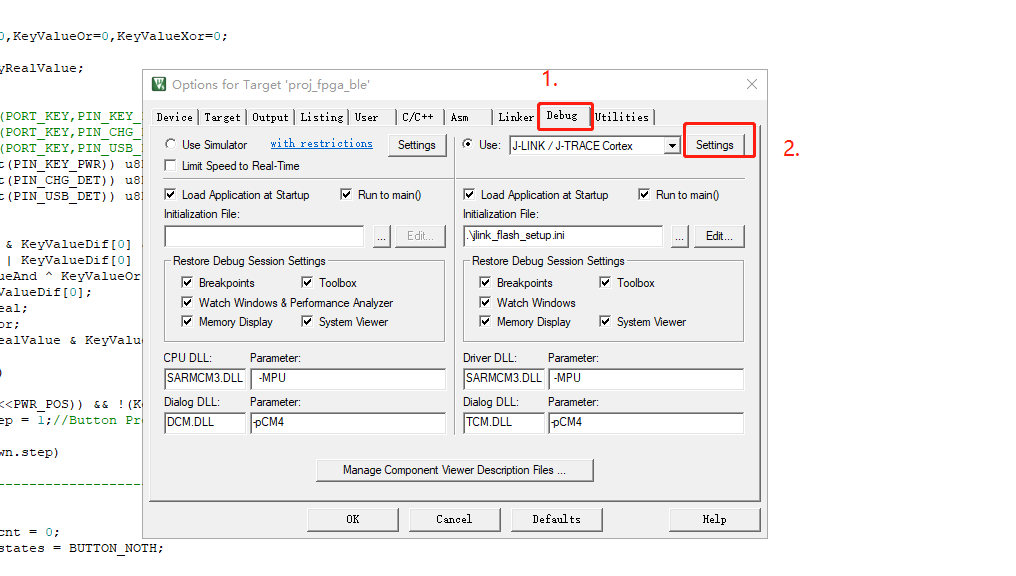
To enter debugging mode during program execution, please follow these steps:
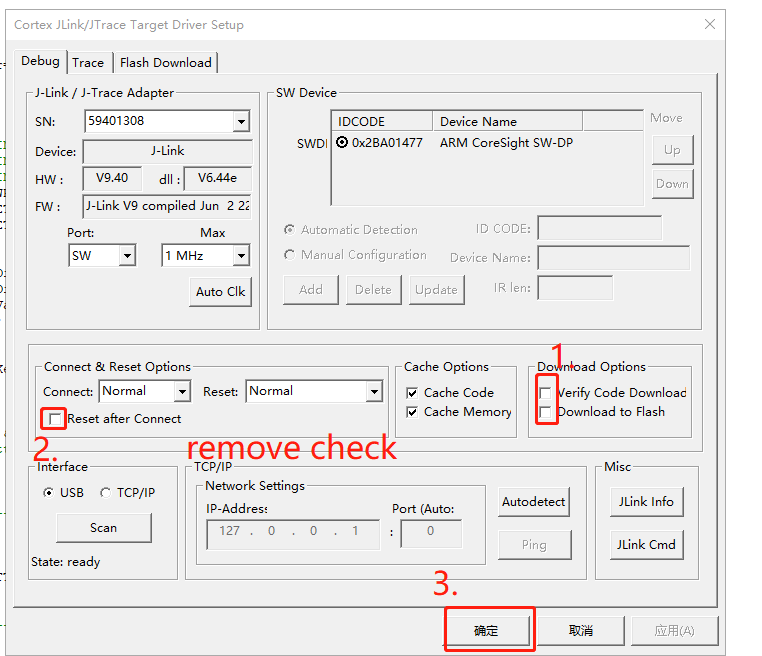
- Remove the options at 1 and 2, and click Confirm.
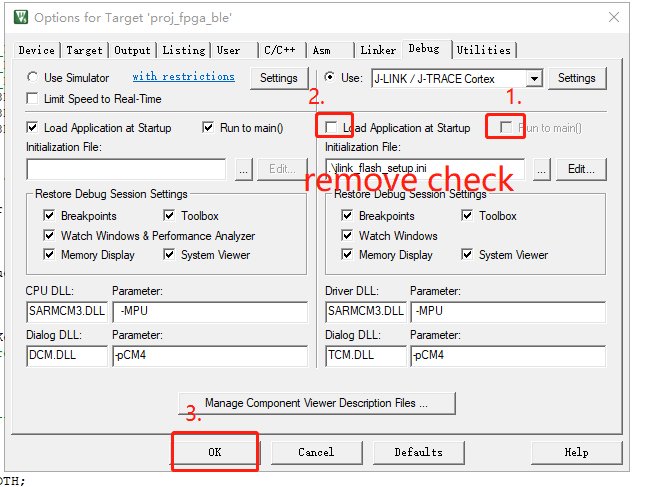
- Remove the options at 1 and 2, and click OK.
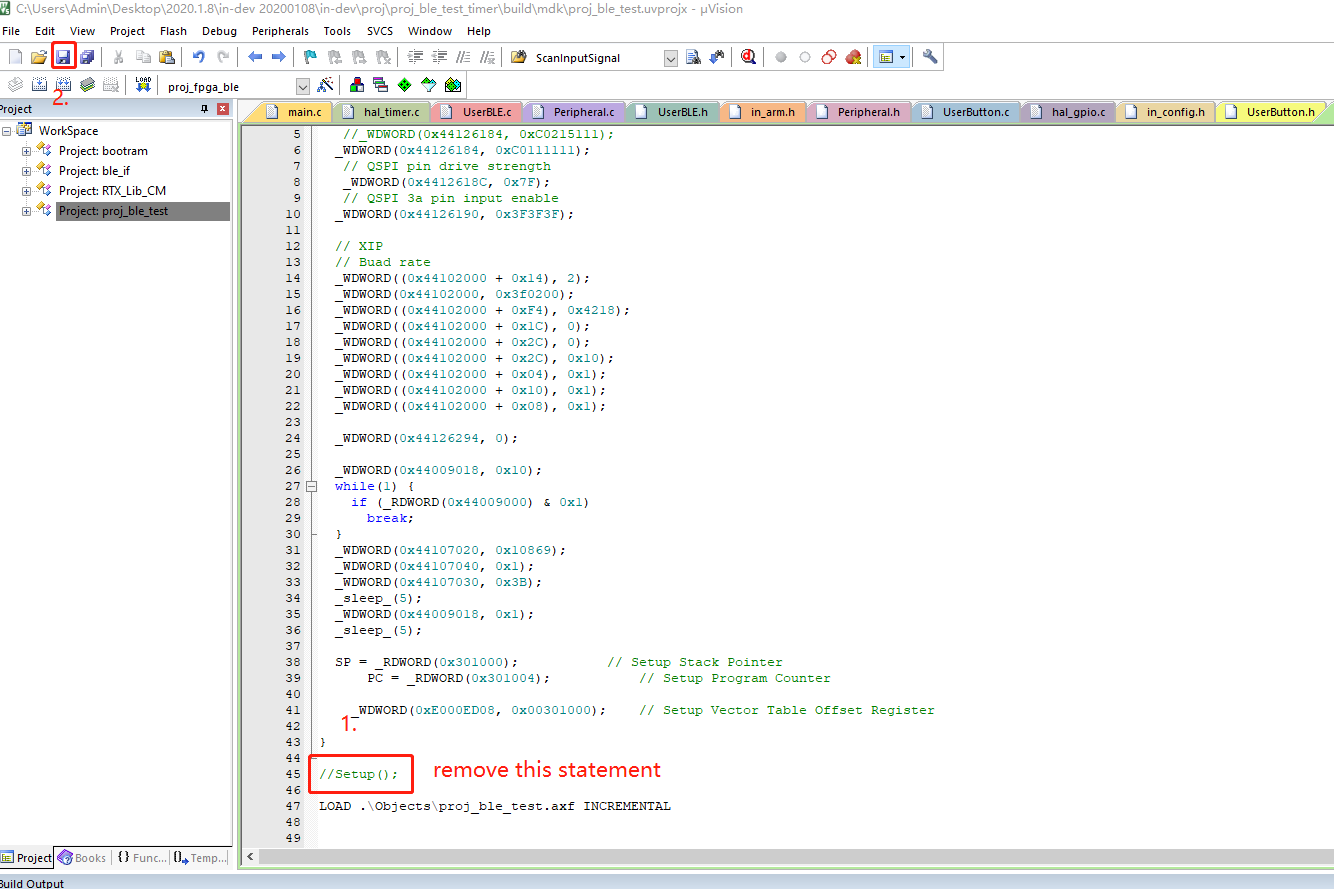
- Edit .ini file.
- Comment out the Setup section.
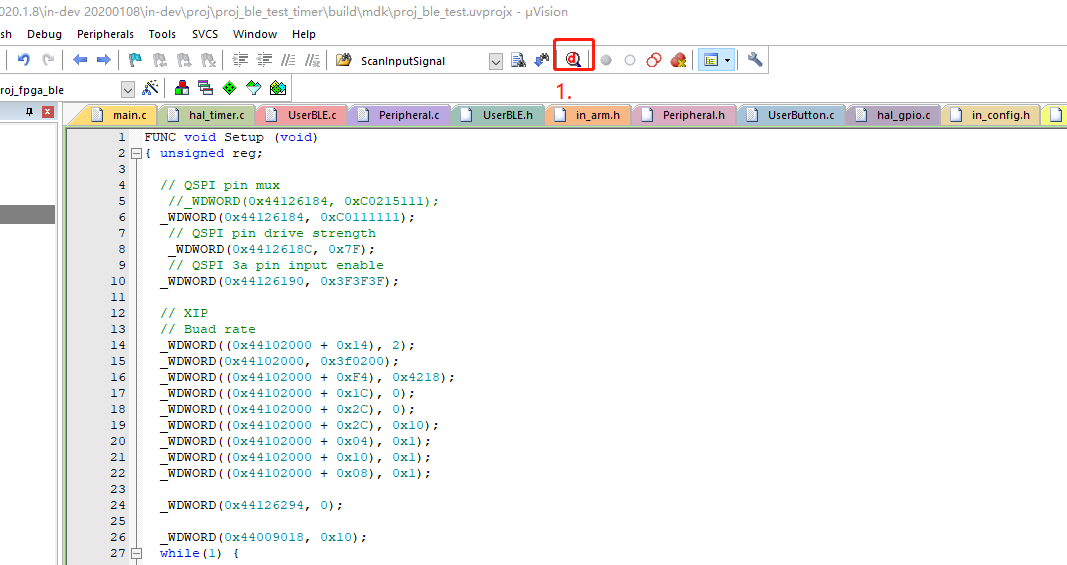
- Click the debug button.
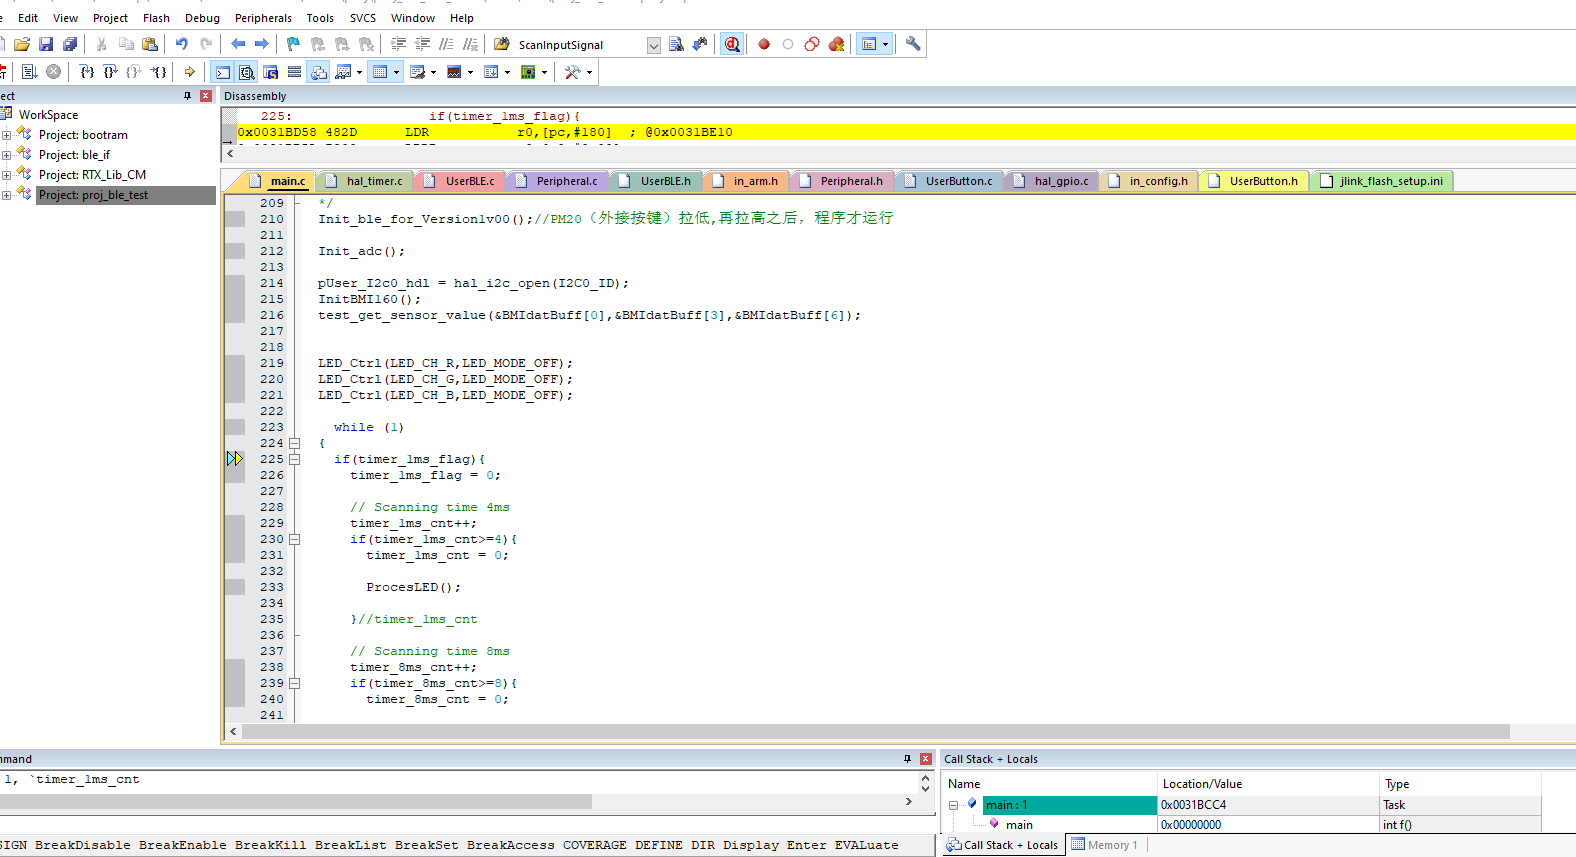
- Enter debugging mode, where you can see the program’s execution position and perform simulation debugging.
Note: #
Setting breakpoints: Breakpoints are crucial tools in the debugging process, as they allow you to pause execution at specific locations in the program. In Keil, you can set breakpoints by clicking on the line number of the code. When the program reaches the breakpoint, it will automatically pause, enabling you to observe the current variable values and program state.
Step-by-step execution: Step-by-step execution is a common operation in debugging, allowing the program to execute one line of code at a time. In Keil, you can perform step-by-step execution by clicking the “Step” button on the toolbar. This helps you observe the execution of the program line by line, identifying potential issues.
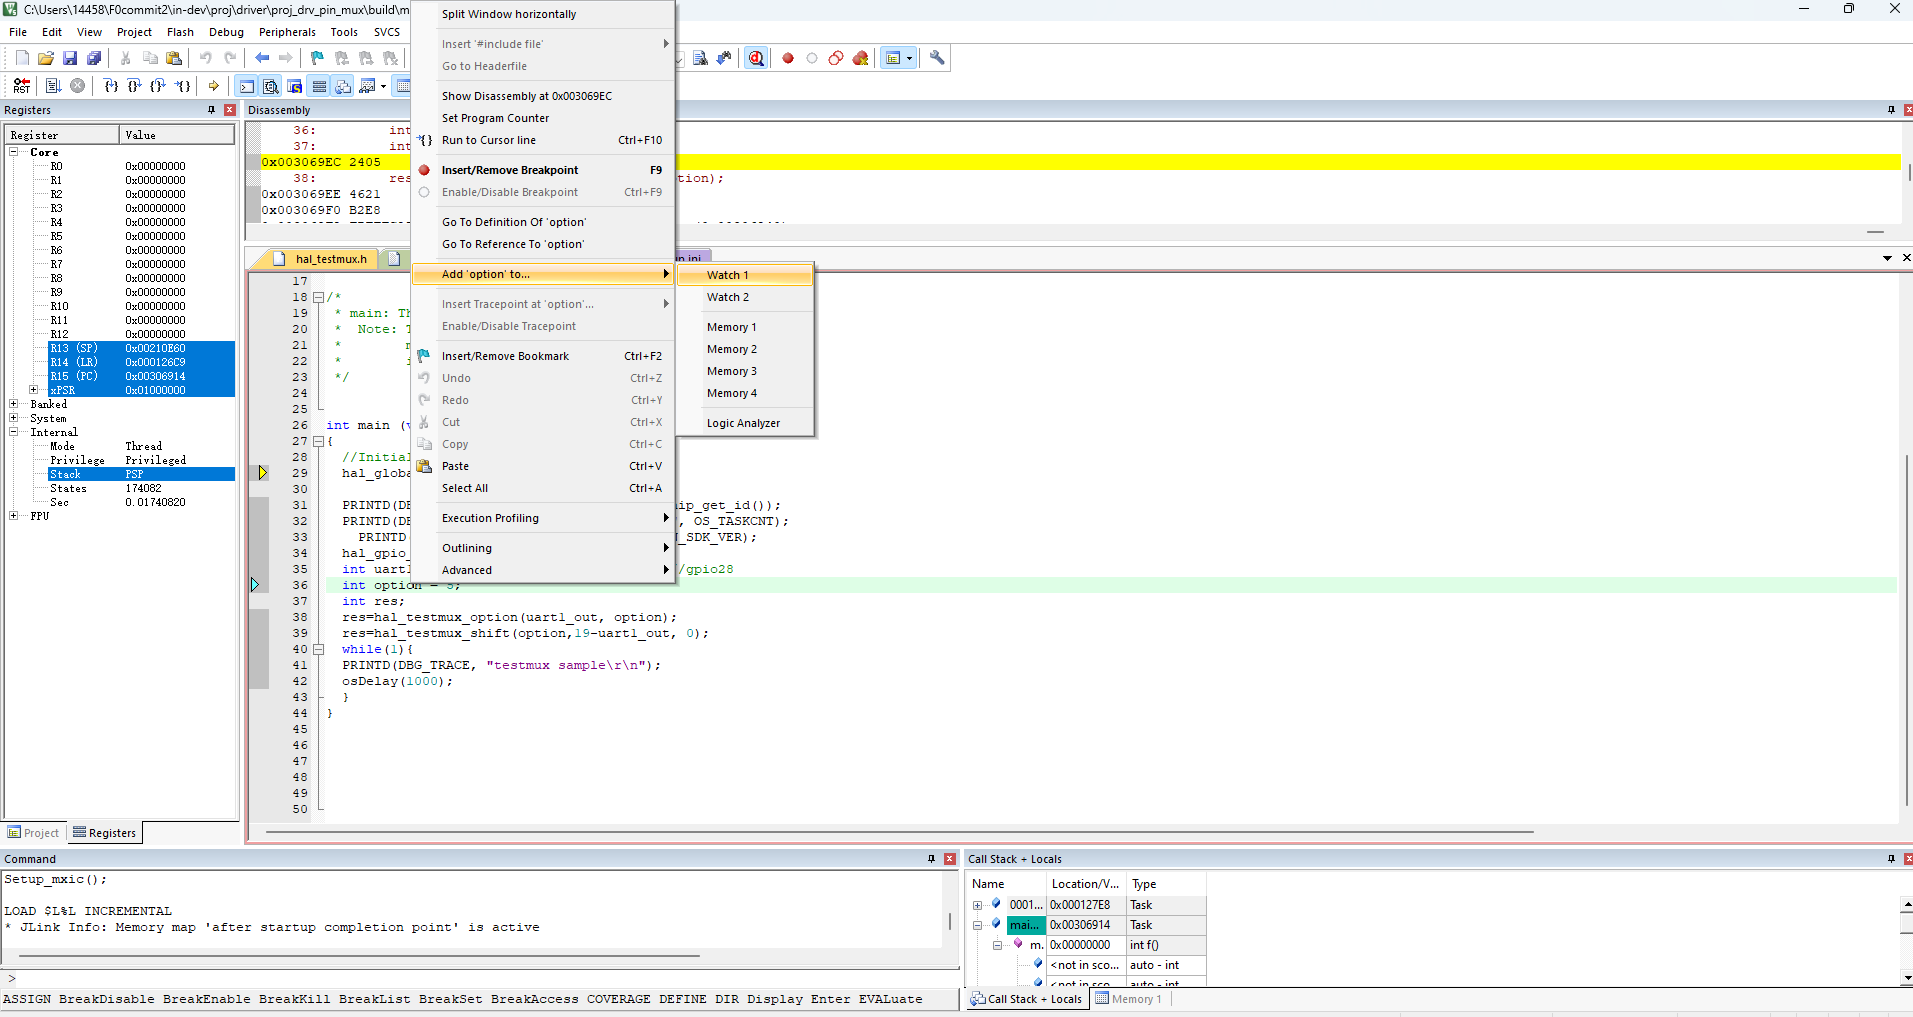
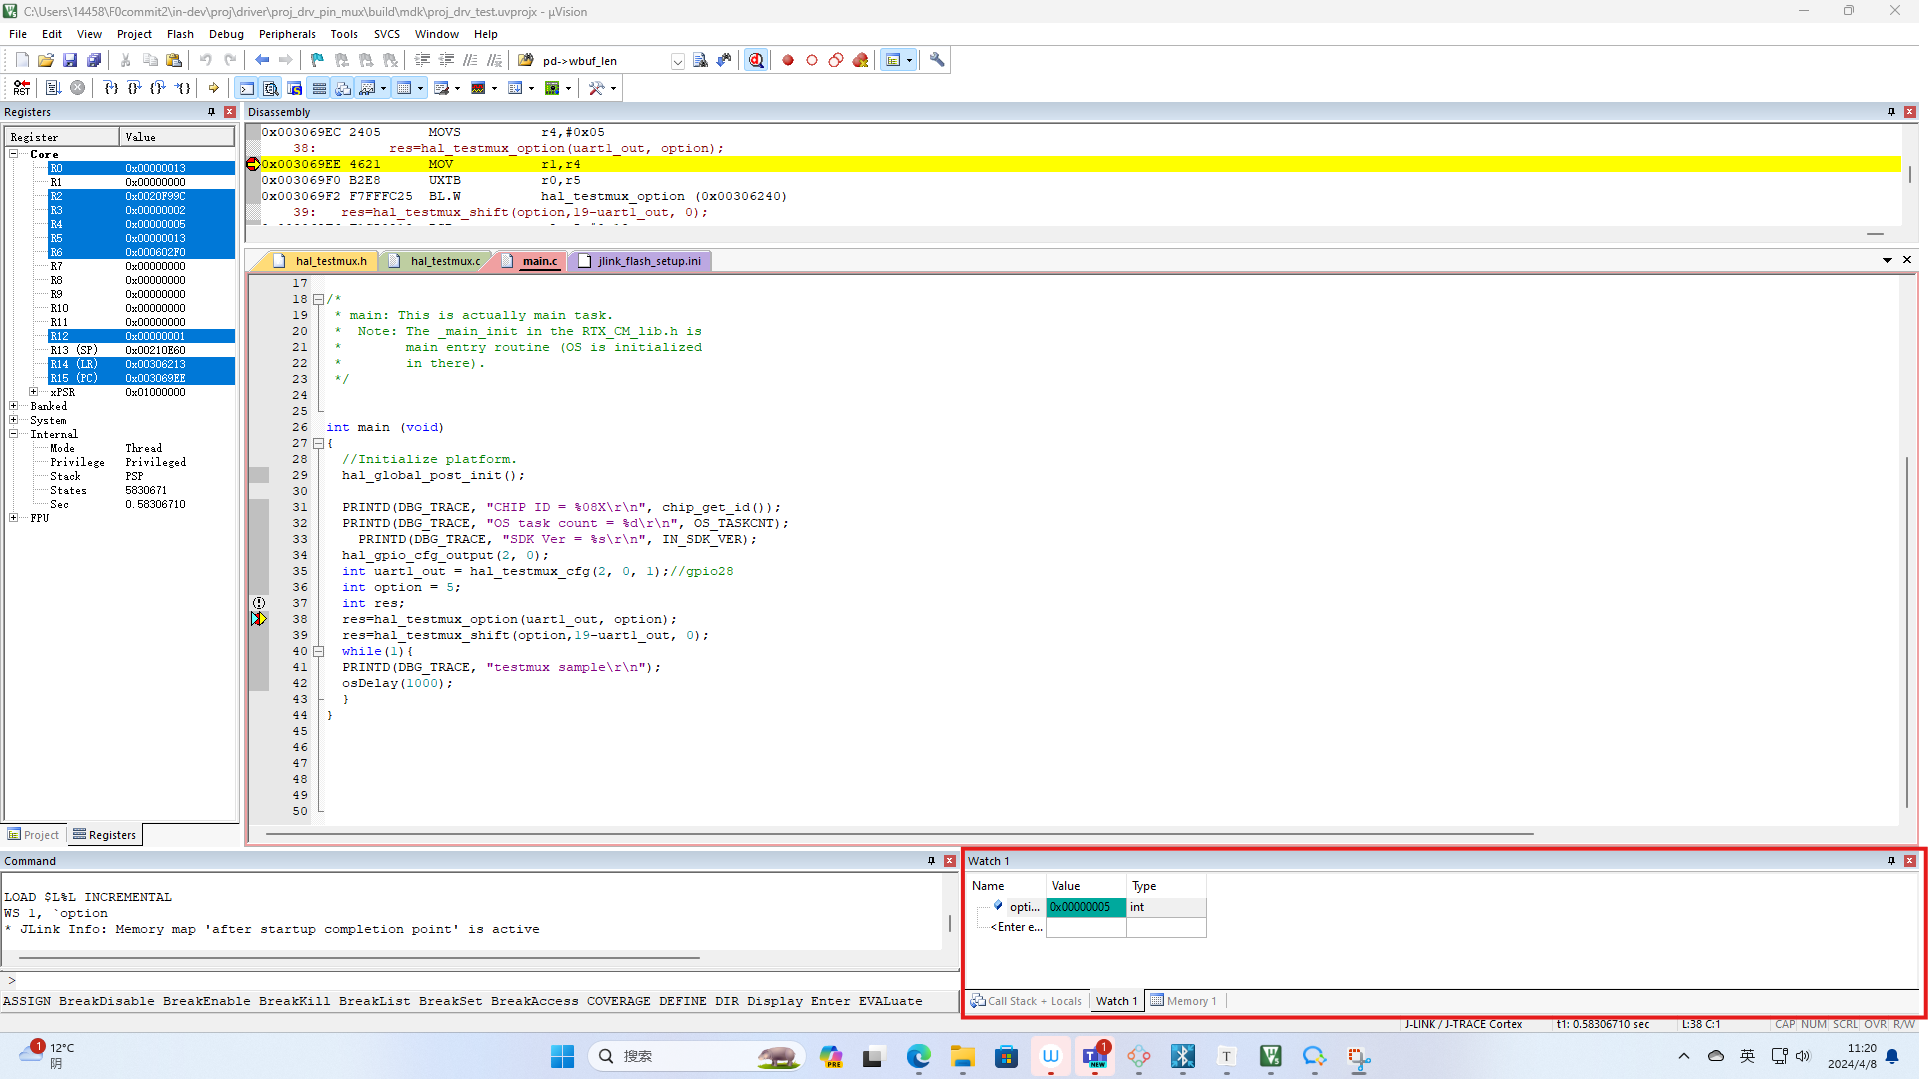
Observing variable values: Observing variable values is crucial during debugging. Keil provides an “Watch Window” to display variable values in real-time. You can add the variables you want to observe to the Watch Window to view their value changes anytime during debugging.
Right-click on the variable you need to observe, and click “Add to Watch1” as shown in the figure. This will allow you to view or modify the value of the variable you are observing in the designated box.
Setting a while(debug) {} loop at the beginning of the main function:When the debug variable is set to a non-zero value (in this case, 1), the while(debug) {} loop creates an infinite loop, suspending further program execution. This allows developers to inspect the initial state of the program, including memory contents, register values, peripheral states, and more.